From Contribution Margin to WACC: The Financial Metrics Playbook
Understanding EBITDA, EBIT, NOPAT, Free Cash Flow, ROIC, and the economics behind investment decisions.
By Hurratul | The U Lab
A company reports $100 million in revenue. Another reports a 75% gross margin. A third announces $20 million in EBITDA. Which one is the better business?
We do not know.
The first might be growing rapidly but losing money on every additional sale. The second might have attractive delivery economics but spend heavily on customer acquisition. The third might report positive EBITDA while consuming substantial cash to maintain its infrastructure.
The problem is not that these metrics are misleading. It is that they answer different questions.
To understand why, let us evaluate a hypothetical company the way an investor would—and then connect profitability to cash flow, capital efficiency, and the cost of capital.
PART I | UNDERSTANDING THE FINANCIAL METRICS
1. Meet AtlasMNOP Software: A $10 Million SaaS Business
Why use one company throughout?
Financial metrics become useful when they describe different layers of the same business. We will start with AtlasMNOP’s income statement, then change one assumption at a time. That allows us to isolate what each metric measures rather than confuse operating performance with financing, accounting classification, or reinvestment.
How to read the statement?
Begin at the top with recognized revenue. Deduct the costs classified as cost of goods sold (COGS) to reach gross profit. Deduct operating expenses to arrive at operating earnings. Account for depreciation and amortization, financing costs, and taxes to reach net income. Each subtotal is a different analytical lens, not a substitute for the full statement. The cash-flow statement and balance sheet provide essential additional information.
AtlasMNOP Software is a fictional B2B company selling subscription-based workflow automation software. Its simplified annual income statement looks like this:

All figures are hypothetical. For clarity, depreciation and amortization are presented separately from COGS and other operating expenses; there are no additional nonoperating items or adjustments.
2. Gross Profit: What Remains After Delivering the Product?
What belongs in COGS?
In a software company, hosting and third-party infrastructure charges may be part of COGS; certain implementation or customer-support costs may also be included depending on the business and its accounting policies. A physical-products company might include materials, direct labor, and manufacturing overhead. Comparing gross profit across businesses therefore requires understanding what management actually classifies as the cost of delivering the product.
What investors should test
Gross profit can rise simply because revenue grows; that does not prove the underlying product has improved. Look at gross profit per customer or transaction, the stability of cost classifications, cloud or fulfillment cost trends, and whether volume discounts are sustainable. An attractive gross profit line is the beginning of diligence, not the conclusion.
AtlasMNOP generates $10 million in revenue but incurs $3 million in COGS. For a software company, COGS may include hosting, infrastructure, and certain support costs, depending on accounting policy. COGS can include both fixed and variable costs.
Gross profit = Revenue − COGS = $10M − $3M = $7M
That $7 million must still cover research and development, sales, marketing, administration, and other expenses. Gross profit is not net income.
Investor question: How attractive are the economics of delivering the core product?
3. Gross Margin: How Much of Each Revenue Dollar Remains?
Why percentages matter Imagine two companies each increase revenue by $10 million. At a 70% gross margin, that additional revenue produces $7 million of gross profit before other expenses; at a 40% margin, it produces $4 million. This is not a forecast, incremental margins may differ from historical averages but it shows why a margin percentage helps translate sales growth into potential operating capacity.
Do not confuse gross margin with incremental margin
A company may report a 70% average gross margin while a new enterprise contract has much lower delivery margins because it requires bespoke implementation. Conversely, economies of scale can make incremental gross margin higher than the companywide average. Ask what happens to costs when the next dollar of revenue arrives.
Gross margin = Gross profit ÷ Revenue × 100 = $7M ÷ $10M × 100 = 70%
Gross profit is a dollar amount; gross margin is a percentage. For every $100 in revenue, AtlasMNOP retains $70 after COGS.

CompanyXYZ earns more gross profit in dollars, while AtlasMNOP retains a higher proportion of sales. Neither observation alone identifies the better investment: growth, retention, operating expenses, capital intensity, competitive position, and valuation also matter.
Remember: Gross profit measures dollars remaining; gross margin measures the percentage remaining.
4. Contribution Margin: Does Another Sale Help Cover Fixed Costs?
The crucial distinction: accounting category versus cost behavior Gross margin asks which expenses are recorded in COGS. Contribution margin asks which expenses change with a defined unit of activity. Rent can be a fixed cost even when classified within COGS. Payment-processing fees can be variable costs even when classified in selling expenses. A cost can also be mixed or step-fixed: for example, hiring another support team once customers cross a threshold. The relevant time horizon matters.
Contribution margin is not the same as customer lifetime value
A first transaction might have negative contribution because the business pays an upfront acquisition cost, while repeat transactions produce positive contribution. In subscription businesses, investors therefore examine cohort retention, lifetime gross or contribution profit, payback periods, and the timing of acquisition spend. Conversely, a seemingly attractive LTV/CAC ratio can conceal long payback periods or optimistic retention assumptions.
A practical diligence question
Ask management to show the contribution margin bridge at the customer, order, or cohort level: revenue; refunds and discounts; direct fulfillment or infrastructure; payment fees; usage-based support; variable sales commissions; and any truly incremental acquisition expense. Specify whether the figure is before or after marketing and what is excluded. “Contribution margin” is not defined identically across companies.
Gross margin classifies costs by accounting function (COGS). Contribution margin classifies costs by behavior (variable versus fixed). Variable costs may sit inside or outside COGS. Contribution margin is measured for a specified activity and period.

Contribution profit = Revenue − Total variable costs = $10M − $3M = $7M
Contribution margin = Contribution profit ÷ Revenue × 100 = 70%
Here, contribution margin happens to equal gross margin. That is coincidence, not a rule: COGS includes $1 million in fixed costs, while contribution costs include $1 million in variable expenses outside COGS.
Now imagine a separate product sold for $100. It incurs $40 in production, $20 in delivery and processing, and $50 in variable customer acquisition costs. Total variable cost is 110;contributionprofitis-10 per sale. Another 10,000 sales generate $1 million in revenue but $1.1 million in variable costs a $100,000 contribution loss before fixed costs.
Growth does not automatically repair negative unit economics. It can amplify them.
Investor question: Does incremental activity contribute toward covering fixed costs, and how do those economics evolve with scale? For recurring-revenue businesses, also examine lifetime value, retention, and acquisition payback. Contribution margin definitions can vary; verify which costs are included.
5. EBITDA: What Is Profitability Before Selected Expenses?
Why EBITDA became popular EBITDA helps compare businesses whose financing arrangements, tax profiles, and historical depreciation charges differ. In a mature operating business, it can be a useful starting point for evaluating operating earnings. It is especially common in acquisition discussions and debt covenants, although precise definitions and adjustments may vary.
The limitation that matters most Imagine two companies with the same $3 million EBITDA. One runs a capital-light software service and needs $200,000 in annual equipment spending. The other must continually purchase servers or machinery costing $2 million a year. Their EBITDA figures look identical, but their cash-generation capacity can be very different. Likewise, deferred customer payments can consume cash even while reported EBITDA is positive.
Adjusted EBITDA requires scrutiny Some companies add back restructuring charges, stock-based compensation, or other items to report “adjusted EBITDA.” Such adjustments may be useful for isolating unusual effects, but they can also make recurring economic costs disappear from the headline. Ask whether an expense is truly nonrecurring, whether it dilutes shareholders, and whether the business must incur a similar cost to keep operating.
EBITDA = EBIT + Depreciation + Amortization = $3M
EBITDA means Earnings Before Interest, Taxes, Depreciation, and Amortization. AtlasMNOP has $7 million in gross profit and $4 million in operating expenses excluding D&A, leaving $3 million in EBITDA.
EBITDA is not cash flow.
It does not deduct capital expenditures or changes in working capital and may include noncash operating expenses such as stock-based compensation. Two companies with identical EBITDA can have very different reinvestment requirements, for example, an asset-light software provider versus a data-center operator.
Investor question: How much of reported profitability ultimately converts into sustainable free cash flow?
6. EBIT: What Is Profit After Depreciation and Amortization?
Depreciation is noncash today, not necessarily costless Suppose a company buys a $5 million piece of equipment and expects to use it for five years. Under a simplified straight-line assumption with no residual value, it recognizes $1 million of annual depreciation. The cash was paid when the asset was acquired, not when each depreciation charge appears. But ignoring depreciation entirely can obscure the cost of maintaining an asset-intensive business.
Why EBIT and EBITDA can tell different stories A cloud-infrastructure operator may show improving EBITDA as capacity utilization rises while depreciation remains substantial because its servers are expensive and become obsolete. A software company with relatively little capital expenditure may have a smaller gap between EBITDA and EBIT. Neither ratio should be interpreted without the balance sheet and the capital expenditure schedule.
EBIT = EBITDA − Depreciation − Amortization = $3M − $1M = $2M
EBIT means Earnings Before Interest and Taxes. It reflects depreciation and amortization but excludes interest and taxes. It commonly approximates operating profit, although reported operating income and EBIT can differ depending on classifications.
Depreciation is noncash when recognized, but the asset may have required significant cash investment and eventually need replacement. Excluding depreciation does not eliminate the underlying economic cost.
Investor question: What do operations earn after recognizing depreciation and amortization?
7. NOPAT vs. Net Income: Separate Operations From Financing
Why the distinction matters If a company borrows more, interest expense can reduce net income even if its product, customers, pricing, and operating costs have not changed. Conversely, repaying debt can improve net income without improving the underlying business. NOPAT removes the financing effect to create a cleaner numerator for evaluating operating returns on invested capital.
A tax nuance worth remembering
Our simplified formula uses EBIT multiplied by one minus a stated tax rate. Real-world NOPAT may require adjusting for nonoperating items, one-time tax effects, operating leases, and differences between statutory and effective cash tax rates. For a loss-making company, multiplying a negative EBIT by a tax-adjusted factor does not necessarily represent taxes actually paid or immediate tax savings. Consistency is more important than false precision.
Introduce OrionPQRS Software, a fictional competitor with the same revenue and EBIT as AtlasMNOP. AtlasMNOP pays $400,000 in annual interest; OrionPQRS has no debt and no interest expense.
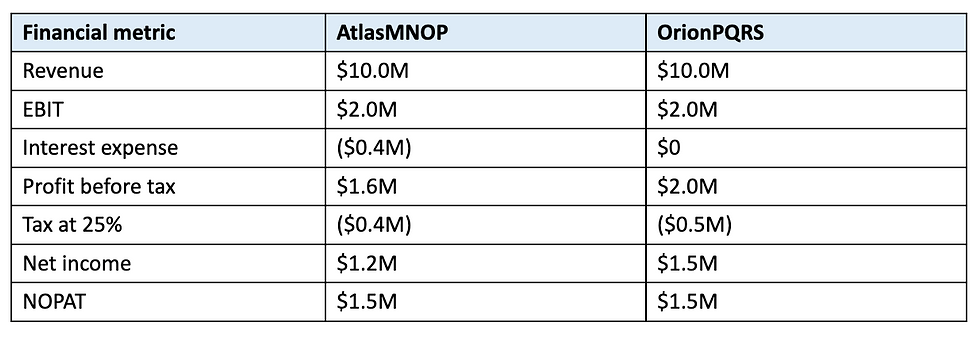
Assumptions: identical revenue and EBIT, the same 25% tax rate, fully deductible interest, and no other income, expenses, or tax adjustments. The companies may differ in capital intensity and invested capital, as the later ROIC example illustrates.
OrionPQRS reports 25% more net income. But its operating business is not more profitable in this example; the difference comes from financing.
NOPAT = EBIT × (1 − Assumed tax rate) = $2M × 75% = $1.5M for each company
Simplified net income = (EBIT − Interest expense) × (1 − Tax rate)
NOPAT (Net Operating Profit After Tax) estimates after-tax operating earnings independent of financing decisions. Net income includes financing costs and associated tax effects, along with other applicable items. Actual NOPAT often requires adjustments to reported operating income and taxes.
Investor question: Are differences in bottom-line profit caused by the operations or by how the business is financed?
PART II | FROM ACCOUNTING PROFIT TO ECONOMIC VALUE
8. Free Cash Flow: What Remains After Reinvestment?
Follow the cash, not just the earnings
Depreciation reduces accounting profit but is added back in this simplified cash-flow bridge because it is not a current-period cash payment. Capital expenditure is then deducted because building or replacing assets requires real cash. An increase in operating working capital also absorbs cash, for example, when customers owe more money or inventory grows faster than supplier credit.
Working capital can reverse the story
A company may recognize revenue today but collect cash in 90 days. If receivables increase, cash generation can lag earnings. Another company might collect annual subscriptions upfront, temporarily improving cash flow through deferred revenue. That advantage may be valuable, but it does not eliminate the future obligation to deliver service. Always ask whether the cash conversion is structural and repeatable.
FCFF is not cash available only to shareholders
Free cash flow to the firm is calculated before interest payments and financing flows; it belongs economically to both debt and equity providers. Free cash flow to equity (FCFE) is a different measure, incorporating the effects of borrowing and debt repayment. Do not mix an enterprise-value valuation with equity-only cash flows or vice versa.
AtlasMNOP reports $3 million in EBITDA, $2 million in EBIT, $1.5 million in NOPAT, and $1.2 million in net income. None alone tells us how much unlevered cash the business generates.
FCFF = NOPAT + D&A − Capital expenditures − Increase in operating working capital

Assumes no additional noncash operating adjustments. FCFF is cash available to debt and equity capital providers after operating costs, operating taxes, and reinvestment, but before financing cash flows.
Investor question: How much cash can the company generate after funding the investments necessary to sustain and grow operations?
9. ROIC: How Much Capital Does It Take to Earn That Profit?
Define the denominator before trusting the percentage
Invested capital is commonly estimated using operating assets minus non-interest-bearing operating liabilities, or through an equivalent financing-side approach. Analysts may adjust for excess cash, goodwill, leases, or acquisitions. Because NOPAT is a flow earned over a period, average invested capital is often preferable to a single year-end balance. Comparisons are only meaningful when the definitions are consistent.
Incremental ROIC matters for growth
A company can have excellent historical ROIC yet poor prospects for deploying its next $100 million. Investors want to know whether new products, new geographies, and incremental capacity can earn attractive returns—not merely whether the existing business was built efficiently. Sustainable growth creates value when incremental returns exceed the cost of the incremental capital required.
AtlasMNOP and OrionPQRS each generate $1.5 million in NOPAT. Now assume they employ different amounts of average invested capital:

ROIC = NOPAT ÷ Average invested capital
AtlasMNOP generates three times the return on invested capital. Profitability tells us what a company earns; ROIC helps tell us how much capital it needs to earn it. Definitions of invested capital must be applied consistently.
A higher ROIC does not automatically imply a better investment. Cost of capital, risk, reinvestment opportunities, growth, and the purchase valuation still matter.
10. WACC: What Does It Cost to Finance the Business?
Why shareholders have a cost even without an invoice A lender receives contractual interest. An equity investor has no guaranteed coupon, but still gives up the opportunity to invest elsewhere and bears the risk of losing capital. The cost of equity is therefore an opportunity-cost estimate: the return investors require to hold this risk rather than an alternative. It is not the dividend yield and it is not a bill the company pays each quarter.
Why use market-value weights?
WACC seeks to represent the current opportunity cost of the capital financing the enterprise. Market values generally capture investors’ current pricing of debt and equity better than historical book values. For a private company, those values may be difficult to observe; analysts may use a defensible target capital structure, comparable companies, and scenario ranges rather than a single precise-looking answer.
Why the tax shield is conditional
The term Rd × (1 − T) recognizes that deductible interest can reduce taxable income. The benefit depends on applicable tax rules and whether the company can use the deduction. A loss-making startup may not obtain the same immediate cash-tax benefit as a profitable established business. More debt can also increase financial distress risk and the required returns demanded by both lenders and shareholders.
Every business uses capital, generally supplied by equity investors and lenders. Equity investors require compensation for ownership risk; lenders require interest. WACC, Weighted Average Cost of Capital, estimates the blended required return on the company’s financing.
WACC = [E ÷ (D + E)] × Re + [D ÷ (D + E)] × Rd × (1 − T)

Interest is generally tax-deductible, subject to tax rules; therefore, the debt component uses its after-tax cost. Equity does not receive an equivalent interest deduction.
Calculate WACC for AtlasMNOP
For this illustrative financing scenario, suppose AtlasMNOP has $20 million in market-value equity and $5 million in debt, giving 80% equity and 20% debt weights. Assume a 15% cost of equity, 8% pretax cost of debt, and a 25% tax rate. For simplicity, assume the debt’s 8% borrowing rate equals its current pretax cost of debt; the $5 million debt balance then produces $400,000 of annual interest, consistent with the earlier income statement. The $25 million market enterprise value differs from the $5 million average book invested capital used for ROIC: market financing values and accounting invested capital measure different things.

Weighted equity cost = 80% × 15% = 12.0%
After-tax debt cost = 8% × (1 − 25%) = 6.0%
Weighted debt cost = 20% × 6.0% = 1.2%
WACC = 12.0% + 1.2% = 13.2%
The 13.2% WACC is a hypothetical required return, not an observed market return. WACC weights use current market values of financing claims; ROIC typically uses an accounting-based operating invested-capital measure. Do not substitute one denominator for the other.
Where does the cost of equity come from? CAPM
Equity has no contractual interest rate. One commonly used estimation approach is the Capital Asset Pricing Model (CAPM):
Cost of equity (Re) = Risk-free rate (Rf) + Beta (β) × Expected market risk premium (Rm − Rf)

Re = 3% + 1.5 × 8% = 15%
This CAPM example produces the same 15% cost of equity assumed in the WACC calculation. All CAPM inputs are hypothetical, not estimates of current market conditions.
Consistent WACC = 80% × 15% + 20% × 8% × (1 − 25%) = 13.2%
WACC is sensitive to its inputs. Estimating beta, cost of equity, and capital structure is especially challenging for early-stage private companies; CAPM is a model, not a directly observable fact.
11. ROIC vs. WACC: Is the Business Creating Economic Value?
A spread is a diagnostic, not a valuation
ROIC above WACC suggests the operations earn more than the estimated required return on capital, under consistent assumptions. But the spread is not the return an investor will necessarily earn on a share purchase. Shareholder returns also depend on growth, future reinvestment, dilution, financing risk, and—critically—the valuation paid today.
Think in terms of incremental value
Suppose a company can reinvest $10 million at a sustainable 20% incremental ROIC while its WACC is 12%. That reinvestment has the potential to create value because the return exceeds the capital charge. If the same investment earns 8%, growth can consume value despite increasing revenue and reported operating profit. Timing, persistence, and risk still matter; these percentages alone do not produce a complete discounted cash-flow valuation.
ROIC measures the operating return earned on invested capital. WACC estimates the required return on that capital. Their spread provides a useful measure of economic performance.

The WACC figures are illustrative, scenario-specific assumptions. AtlasMNOP’s 13.2% WACC is consistent with the 15% CAPM example and the $400,000 annual interest expense. OrionPQRS is assumed to be entirely equity-financed with a 12% required equity return, so its WACC is 12%. The two companies have equal revenue and EBIT in this example, but different invested capital and assumed financing costs; they are not identical businesses in every respect.
AtlasMNOP earns more than its assumed cost of capital; OrionPQRS earns less. Both are accounting-profitable, but under these assumptions they have different economic profitability.
Economic Profit: Put a Dollar Value on the Spread
Economic profit = NOPAT − (WACC × Average invested capital)
Equivalent: Economic profit = (ROIC − WACC) × Average invested capital
AtlasMNOP: $1.5M − (13.2% × 5M)=+840,000
OrionPQRS: $1.5M − (12% × 15M)=-300,000
Despite identical operating profits, AtlasMNOP generates positive economic profit while OrionPQRS falls short of its estimated capital charge. The comparison uses average invested capital as a simplified proxy for the capital base over the period.
A company can report positive accounting profits while failing to earn its cost of capital.
Important venture caveat: Young companies often have negative EBIT, uncertain future capital needs, and no observable cost of equity. Historical ROIC and WACC may therefore be less informative than projected unit economics, incremental returns, cash needs, and scenario-based valuation.
PART III | THE INVESTOR’S FRAMEWORK
12. The Metrics, Side by Side
A useful sequence for diligence Start with what the company sells and how reliably revenue is recognized. Test delivery economics through gross margin, then isolate variable economics with contribution margin. Reconcile EBITDA to EBIT and NOPAT. Follow NOPAT into free cash flow by examining reinvestment. Finally, compare operating returns with capital employed and its cost. Each step should challenge, not merely confirm, the conclusion from the previous one.

These measures are complementary, not interchangeable. Contribution margin is a managerial measure; NOPAT, FCFF, ROIC, WACC, and economic profit require consistent definitions and sometimes accounting adjustments.
MY READ | THREE DISTINCTIONS THAT MATTER IN VENTURE CAPITAL
1. Revenue Growth Is Not Value Creation
A startup growing 100% with negative contribution margins and expensive customer acquisition may have weaker economics than one growing 40% with positive contribution margins and durable retention. The right answer depends on the future business model, market structure, and valuation, not growth alone.
Revenue growth → Incremental contribution → Fixed-cost absorption → Operating leverage → Potential cash generation
This sequence is conditional. If incremental sales have negative contribution profit, scaling may increase losses. I would evaluate whether additional revenue improves the underlying economics, not merely the headline growth rate.
2. Accounting Profit Is Not Cash Generation
Positive EBITDA does not guarantee free cash flow. Capital expenditures, changes in working capital, operating taxes, and other cash adjustments explain why EBITDA and unlevered cash flow diverge. Financing decisions also affect cash available to equity holders, but financing cash flows are excluded from FCFF. This is particularly important in capital-intensive businesses, including AI infrastructure.
Operating earnings → Operating taxes and noncash adjustments → Reinvestment → Free cash flow
I would use EBITDA as one analytical lens, not a substitute for evaluating capital intensity and cash conversion.
3. High Margins Are Not High Returns on Capital
A high-margin company can require heavy spending on customer acquisition or infrastructure. A lower-margin business may use capital more efficiently. NOPAT and ROIC connect operating earnings to the capital needed to produce them; WACC tests whether those returns are adequate.
Operating profitability → Capital efficiency → Economic value creation → Investment returns (subject to valuation)
Even an exceptional business can be a poor investment if the entry price assumes more future success than the company can deliver.
THE BIGGER PICTURE
The useful way to learn financial metrics is not to memorize isolated formulas. It is to understand the different economic questions each metric answers.
Revenue measures sales. Gross profit and gross margin describe delivery economics. Contribution margin explains incremental cost behavior. EBITDA and EBIT reveal different layers of profitability.
NOPAT separates operations from financing. Net income reports bottom-line accounting earnings. FCFF accounts for reinvestment. ROIC measures capital efficiency. WACC supplies the required-return benchmark. Economic profit measures the spread in dollars.
The objective is not simply to identify a fast-growing or profitable company. It is to understand whether the business can generate durable cash flows and earn attractive returns on the capital required to sustain its growth and whether the investment price leaves room for an attractive return.
Disclaimer: All company names, figures, and scenarios are hypothetical and for educational purposes. This newsletter is not financial or investment advice.


Comments