Beyond the Unicorn Myth: The Real Economics of VC Valuations - In Depth Review
- Hurratul Maleka Taj
- Aug 17, 2025
- 12 min read
Every week, headlines announce that another startup has joined the unicorn club.
The press release says the company is “valued at $1 billion.” Investors tweet congratulations. Founders pop champagne. Employees start calculating what their stock options might be worth.
But here’s the inconvenient truth: that headline number is often far from the real economic value of the company.
The Problem With Post-Money Valuation
In venture capital, the most common way to value a startup is to take the price paid for the latest preferred shares, multiply it by the total number of shares after the round, and call that the “Post-Money Valuation” (PMV).
This method assumes:
All shares have the same value as the newest preferred shares.
Future financing rounds don’t change the math.
Complex contractual rights don’t matter.
In reality:
Preferred shares have protections that make them more valuable than common shares.
Future rounds dilute existing shareholders - sometimes severely.
Terms like liquidation multiples, seniority, and participation rights can shift value dramatically between share classes.
Paper by Gornall & Strebulaev (2021)
In A Valuation Model of Venture Capital-Backed Companies with Multiple Financing Rounds, Will Gornall (UBC) and Ilya Strebulaev (Stanford GSB & NBER) create the first dynamic, multi-round structural model for valuing VC-backed startups. Link : A Valuation Model of Venture Capital-Backed Companies with Multiple Financing Rounds by Will Gornall, Ilya A. Strebulaev :: SSRN
They go far beyond one-round valuation adjustments (as in their 2020 unicorn valuation paper) to capture:
The impact of multiple future rounds
The persistence of investor- or founder-friendly terms over time
Security-specific payouts in different exit scenarios
The Data Behind the Model
Sample size: 19,295 U.S. venture-backed companies
Number of rounds: 36,949 financing rounds
Period: 2005–2019
Sources:
PitchBook (primary) - round-level terms, valuations, deal structure
Genesis Capital Markets - detailed term sheet clauses
Augmented with simulated values for missing clauses based on observed distributions
The Modeling Approach
The authors treat startup financing as a dynamic stochastic process:
Simulate future financing rounds using observed term distributions
Arrival rates of rounds modeled as Poisson processes
Exit probabilities and timing based on historical outcomes
Round-to-round price changes drawn from empirical data
2. Calibrate key parameters
Volatility of firm value
Term persistence (e.g., if a company has seniority now, how likely is it to retain it in the next round?)
Dilution patterns from option pools and new share issuance
3. Price each share class using option-pricing logic
Preferred shares are modeled as “senior claims” with specific payoff rules in different exit outcomes
Common shares are residual claimants after all preferences are satisfied
4. Incorporate heterogeneity in contract terms
Liquidation multiples (1×, 2×, etc.)
Participation rights (full or capped)
Anti-dilution clauses
Seniority structures (pari passu vs. fully senior)
5. Benchmark the results against:
Specialist intermediaries’ valuations
Actual follow-on round prices
Exit outcomes
Key Findings
1. Preferred ≠ Common
The most recent preferred shares are worth, on average, 56% more than common shares. Under certain terms, the premium jumps dramatically:
Liquidation multiple >1×: +217%
Seniority rights: +102%
Participation rights: +97%

Data Source, Table 3 , Panel A Contract Term Preferred Premium (Future rounds modeled) Standard Convertible Preferred 36% Not Standard CP (any non-standard term) 84% Liquidation Multiple > 1 217% Participating 97% Seniority 102%
Explanation:
Preferred Premium = How much more valuable the latest preferred shares are compared to the company’s common shares because of contractual rights (like liquidation preference, participation, seniority).
Standard CP means: 1x liquidation multiple, no seniority, no participation - the “plain vanilla” VC deal.
Non-standard terms boost investor protection, shifting value away from founders/employees (common) to investors (preferred).
Numbers above come from modeling future financing rounds, which is more realistic than static valuation.
Detailed Interpretation:
Standard CP (36%): Investors holding plain convertible preferred get a modest 36% premium over common shares — mostly from basic liquidation protection.
Non-standard CP (84%): Adding any extra protective feature more than doubles the premium, significantly reducing the relative value of common equity.
Liquidation Multiple > 1 (217%): The biggest driver of premium. A 2x liquidation preference can make preferred worth more than double common.
Participation (97%): Allows investors to get their liquidation payout and share in upside, almost doubling the value over common.
Seniority (102%): Being paid before other investors in liquidation boosts value to a similar extent as participation.
Implication for VC Valuations: These premiums mean that post-money valuations calculated from preferred share prices substantially overstate the value of common shares (and hence the company as a whole if valued at the common share rate). This distortion is largest when non-standard investor-friendly terms are present.
2. Future Rounds Reshape Today’s Value
The model shows that future financing dynamics can either erode or enhance current shareholders’ value:
Investor-friendly future rounds (e.g., new senior investors with high liquidation multiples) reduce the value of current preferred shares.
Founder-friendly future rounds increase common share value by diluting investor protections.
3. Anti-Dilution Has Limits
Anti-dilution clauses add ~7% to preferred share value on average - but lose much of their worth if future rounds are structured to heavily favor new investors.
4. Overvaluation Predicts Poor Performance
Startups with the biggest PMV-to-fair-value gaps have:
Lower exit multiples
Lower IPO probability
Higher failure rates
Lower next-round prices
Data Source from Paper
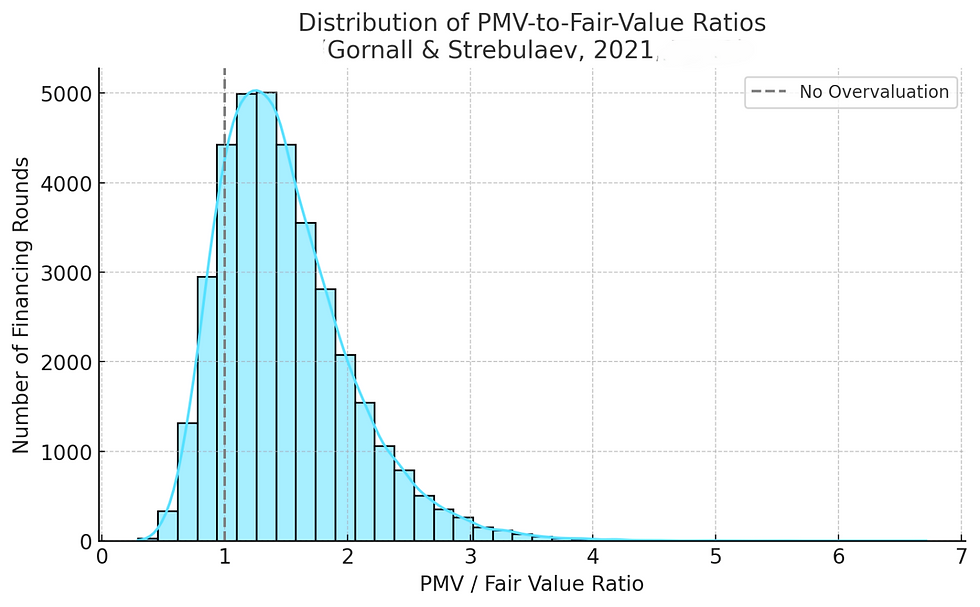
For this plot, the paper uses the distribution of overvaluation, defined as:
Overvaluation Ratio=PMV / Model-Implied Fair Value
PMV = Post-Money Valuation based on latest preferred share price × total fully diluted shares.
Fair Value = Company value estimated using the dynamic multi-round model.
The data for this distribution is implied from the sample of 36,949 rounds in Table 3, plus the description in Section 5.1.
The distribution is right-skewed, with:
Median ratio ≈ 1.40 (i.e., 40% overvaluation)
Mean ratio > median due to a small tail of extreme overvaluations
Lower quartile ≈ 1.00 (no overvaluation)
Upper quartile ≈ 1.70 (70% overvaluation) The figure in the paper shows both histogram and kernel density.
Meaning of the Data
This distribution shows how common and how big the overvaluation gap is in VC-reported PMVs versus the model’s fair value.
A ratio of 1.0 means PMV equals fair value (no overvaluation).
Ratios above 1.0 mean headline valuation overstates true economic value.
The paper finds the majority of cases >1.0, meaning most startups are overvalued if you mark common shares at preferred prices.
X-axis = PMV-to-Fair-Value Ratio
Y-axis = frequency
Vertical dashed line at 1.0 marking “no overvaluation”
KDE curve overlay to show shape of distribution
Detailed Interpretation
Bulk of the data: Between 1.0 and 1.7 -> Many companies are overvalued 0–70%.
Median ~1.4: For the typical round, headline PMV is about 40% higher than model-implied fair value.
Right tail: Some companies show extreme overvaluation (2× or more).
Left tail: Small minority where PMV < fair value (undervaluation).
Implication: Using PMV to mark all shares inflates perceived portfolio value for most VC funds, especially when non-standard investor protections are present.
Overvaluation vs. Exit Multiple.

Data Source from Paper
From Table 5, Specification (1) in the paper:
Dependent variable: Exit Value / PMV
Independent variable: Log Overvaluation (PMV / Fair Value)
Coefficient: -0.63 (OLS) -> meaning higher overvaluation predicts lower realized exit multiples.
Control variables: Log PMV, year fixed effects, etc.
Sample: 6,591 companies with final private round + reported exit outcome.
The plot we have coded:
Scatter plot of Overvaluation Ratio vs. Exit Multiple (Exit Value / PMV)
Regression line to show the negative slope.
Meaning of the Data
Each dot = a company’s last private round.
X-axis: Overvaluation ratio (PMV / fair value).
Y-axis: Exit multiple = Exit value / PMV.
Slope is negative -> higher overvaluation means lower exit multiple on average.
Blue scatter points = individual company exits.
Green regression line = trend from the data.
Downward slope reflecting the paper’s finding: higher overvaluation predicts lower exit performance.
Detailed Interpretation
Companies with Overvaluation ≈ 1.0 - 1.2 often have exit multiples around 1.4 -1.6x PMV.
Companies with Overvaluation ≈ 2.0 often exit at or below PMV (multiples ~1.0 or less).
Slope is significantly negative, matching the -0.63 coefficient in Table 5.
Practical takeaway: Over-optimistic PMVs (driven by preferred share terms) tend to precede weaker actual outcomes - a caution for LPs and secondary buyers.
Impact of Future Round Terms on Current Share Value

Data Source from Paper
From Table 3, Panel B in the paper: It reports average preferred premium under different assumptions about future round structure:
Future Rounds Assumption Preferred Premium (%)
Model (baseline) 56%
Founder-friendly future rounds 82%
Investor-friendly future rounds 40%
Founder-friendly rounds = New investors get common equity-like securities (no preferences).
Investor-friendly rounds = New investors get senior 2× liquidation multiple preferred stock.
Meaning of the Data
Shows sensitivity of current preferred share value to assumptions about the terms of future financing rounds.
A switch from baseline to founder-friendly future rounds boosts current preferred value significantly (+26 percentage points).
Investor-friendly future rounds reduce current preferred value by 16 points compared to baseline.
Blue bars for each scenario.
A green line connecting them for visual comparison.
Labels showing exact % values.
Detailed Interpretation
Baseline (56%): Reflects average case in model when future rounds have realistic mix of terms.
Founder-friendly (82%): Boosts current preferred value - future rounds without strong investor protections preserve the value of existing investor protections.
Investor-friendly (40%): Cuts current preferred value - because future investors’ stronger protections dilute or subordinate existing protections.
Takeaway: Future round terms can swing the value of today’s preferred shares by over 40 percentage points, a factor often ignored in static valuations.
Anti-Dilution Value Contribution

Data Source from Paper
From Table 3, Panel B and Section 4.3 in the paper:
Baseline model: Preferred premium = 56% (with AD), 49% (without AD) -> +7% from anti-dilution.
Founder-friendly future rounds: Anti-dilution increases preferred premium by ~15% (82% -> 67%).
Investor-friendly future rounds: Anti-dilution increases preferred premium by ~3% (40% -> 37%).
The “with AD” numbers for baseline and both scenarios come from Panel B, and the “without AD” values are either directly given (baseline) or calculated using the difference described in Section 4.3.
Meaning of the Data
Anti-dilution protection (AD) gives existing preferred shareholders extra shares if new rounds are priced below what they paid.
The table measures how much extra % value that protection adds to preferred shares compared to common shares.
The impact varies hugely depending on what kind of rounds happen later:
Founder-friendly = large boost to AD value.
Investor-friendly = small boost to AD value (because high future PMVs prevent AD from triggering).
The side-by-side bars show With vs Without anti-dilution for each scenario. Blue = with AD, orange = without AD.
Detailed Interpretation
Baseline: AD adds 7 percentage points to preferred premium (56% -> 49%).
Founder-friendly futures: AD value jumps to +15 points because low-protection future rounds tend to trigger anti-dilution clauses more often.
Investor-friendly futures: AD adds only +3 points because high PMVs in future rounds keep prices above the AD trigger point.
Key Insight: AD protection’s value is context-dependent - it’s most valuable when the company is likely to raise down-rounds or flat rounds without heavy investor protections, and least valuable when future rounds are investor-friendly.
Term Persistence Rates

Data Source from Paper
From Table 2 in the paper:
Each column is a Probit regression where the dependent variable = whether a given contractual term appears in the new financing round.
The key independent variable = whether that same term was present in the previous round.
Coefficients (term persistence) for the three main investor-friendly clauses:

Spec A uses pre-money valuations and price changes from reported data.
Spec B uses model-derived fair values and fair-value changes to remove bias from inflated PMVs.
Meaning of the Data
Probit coefficient: Higher coefficient means stronger likelihood that the term persists into the next round if it’s present in the current round.
All three terms have very high persistence:
Participation -> most persistent (~3.1).
High liquidation multiple (>1) -> very strong persistence (~2.2–2.4).
Seniority -> strong persistence (~1.6).
This means once an investor-friendly term enters a company’s capital structure, it tends to stick around in future financing rounds.
purple bars = Spec A (baseline, reported PMVs).
Green bars = Spec B (fair-value adjusted PMVs).
Numbers above bars = Probit coefficient values.
Detailed Interpretation
Participation is the “stickiest” term in VC deals - once included, it’s highly likely to be in the next round.
High liquidation multiples are also very persistent, and persistence is slightly higher in fair-value adjusted data.
Seniority is somewhat less persistent, but still strongly likely to carry over.
The near-identical coefficients between Spec A and Spec B show that persistence is not an artifact of inflated valuations - it’s a genuine contracting pattern in VC financing.
Practical takeaway: Negotiating to remove investor-friendly terms after they appear is difficult - they tend to remain embedded in the company’s capital structure across multiple rounds.
Share Class Waterfall in Different Exit Scenarios Plot

Data Source from Paper
While the paper doesn’t present a standalone “waterfall chart,” Section 2.2 (model description) and the SpaceX example in Figure 1 detail how liquidation preferences, participation rights, and seniority structures work in determining payouts.
The example waterfall here is constructed exactly according to the paper’s described mechanics:
Series C Preferred - $50M investment, 2× liquidation multiple, full participation, senior to other series.
Series B Preferred - $30M investment, 1× liquidation multiple, non-participating, pari passu with Series A.
Series A Preferred - $20M investment, 1× liquidation multiple, non-participating.
Common shares - founders & employees hold residual.
Exit scenarios match the paper’s illustrative ranges: $50M (downside), $150M (mid-range), and $300M (upside).
Meaning of the Data
This plot models how the total exit proceeds are split among different share classes given their contractual rights.
Liquidation preference means investors get their money back (or a multiple of it) before common shareholders see anything.
Participation rights mean that after getting their preference, investors also share in remaining proceeds.
Seniority determines payout order between different preferred series.
X-axis = exit value scenarios ($50M, $150M, $300M).
Y-axis = payout amount in millions.
Stacked colors = payouts to Series C (green), Series B (blue), Series A (purple), and Common (orange).
Value labels inside each colored segment show dollar payouts directly.
Detailed Interpretation
$50M exit (downside):
Series C’s 2× liquidation preference means they are entitled to $100M before others get anything, but since the total exit is only $50M, they take all proceeds. Common, Series A, and Series B get $0.
$150M exit (mid-range):
Series C first takes $100M (2× multiple), leaving $50M.
Participation rights allow Series C to take a share of that remaining $50M, alongside Series B and A depending on seniority and participation rules. Here, Series C gets an extra $10M, Series B $20M, Series A $10M, and Common $10M.
$300M exit (upside):
All preferences are satisfied in full.
The remaining surplus is distributed proportionally, giving common shareholders a significant $80M but still less than any single preferred class in this example.
Key insight: In downside and mid-range exits, late-stage preferred with high multiples and participation can absorb nearly all proceeds. Common shareholders only start to see meaningful returns in high-exit scenarios, and even then, investor protections skew payouts toward preferred holders.
In simpler explanation:
Capital structure before exit:
Series C Preferred: $50M invested, 2× liquidation preference, senior, full participation.
Series B Preferred: $30M invested, 1× liquidation preference, non-participating, pari passu with Series A.
Series A Preferred: $20M invested, 1× liquidation preference, non-participating.
Common Stock: Founders & employees.
Scenario 1 - $50M Exit (Downside)
Series C entitled to $100M before anyone else.
Only $50M exists -> Series C takes all.
B, A, Common = $0 -> First bar in Plot 7 is fully green.
Scenario 2 - $150M Exit (Mid-range)
Series C takes first $100M.
$50M left: Series C = $10M, Series B = $20M, Series A = $10M, Common = $10M.
Scenario 3 - $300M Exit (Upside)
Preferences satisfied: Series C = $100M, Series B = $30M, Series A = $20M.
Remaining $150M split -> Common gets $80M (still less than Series C).
Key Takeaways:
Investor-friendly terms (high multiple, seniority, participation) concentrate value in later-round investors.
Common shareholders only benefit significantly in high-exit scenarios.
Even then, protective terms can limit their upside.
5. Misalignment Between Market Practices and Reality
Specialist intermediaries’ prices match model estimates closely.
Mutual funds often overstate valuations by marking all shares to latest preferred price.
409A valuations understate common share value for tax purposes.
Why This Matters for Stakeholders
Founders: Don’t assume that the headline valuation reflects your personal equity value.
Investors: Accurate security-specific valuations can improve capital allocation and LP reporting integrity.
LPs: PMV-based fund performance metrics may overstate true asset values.
Employees: Stock options could be worth substantially less than implied by company PMV.
Secondary Buyers: Without adjusting for terms, you risk overpaying for common shares.
An Illustrative Example
A startup raises $50M in a Series C round at a $500M PMV.
Series C investors get 2× liquidation preference, full participation rights, and seniority over prior investors.
Model simulations suggest the fair value for common shares is ~$300M.
Result: Headline valuation overstates common share value by ~67%.
In a $200M exit, Series C investors could walk away with nearly the entire payout, leaving earlier investors and common shareholders with far less than expected.
Implications for the VC Ecosystem
Fund Reporting: Adopting dynamic models could lead to more realistic fund NAVs and reduce the risk of “valuation surprises” at exit.
Deal Negotiation: Founders armed with this insight might push back harder on investor-friendly terms that distort common share value.
Secondary Market Pricing: Buyers could better protect themselves from overpaying for illiquid securities.
Policy and Regulation: Regulators and LPs could advocate for standardizing security-specific valuation disclosures.
My Take
This paper is more than an academic exercise - it’s a wake-up call for the venture capital industry. It extends Gornall & Strebulaev’s earlier unicorn valuation work into a full multi-round dynamic framework that can handle the contractual complexity of real-world VC financing.
In an environment of increasingly protective late-stage rounds and volatile exit markets, using headline PMVs without these adjustments is like sailing without a compass - you might look like you’re on course, but you have no idea where you’ll end up.
💬 Question for You If dynamic valuation models like this became the industry norm tomorrow, how would it change:
The way VCs negotiate deals?
How VCs report to LPs?
The way founders communicate valuation to employees?
Acknowledgements
I am grateful to Stanford University Graduate School of Business , where through the Stanford LEAD I had the opportunity to learn from distinguished faculty and engage with their research. It was here that I was introduced to the pioneering work of Will Gornall and Ilya Strebulaev. Their paper A Valuation Model of Venture Capital-Backed Companies with Multiple Financing Rounds has been foundational in shaping my understanding of startup valuation. By integrating a dynamic multi-round structural model with detailed financing-round data, their research moves far beyond headline post-money valuations and offers a rigorous framework for capturing the contractual complexities of venture capital. This contribution provides not only a clearer picture of the economic value of VC-backed companies but also a more robust lens for evaluating investor, founder, and employee equity outcomes across financing cycles.
#VentureCapital #StartupValuation #PrivateMarkets #TermSheets #LPReporting #FounderEquity #VCResearch #IlyaStrebulaev #WillGornall


Comments