How Cloud Computing Sparked the “Spray-and-Pray” Era of Venture Capital: In-Depth Review
- Hurratul Maleka Taj
- Jun 18, 2025
- 11 min read
Over the past two decades, venture capital (VC) has undergone a seismic shift. But one question stands out: Did the rise of cloud computing completely rewire how VCs invest?
A groundbreaking study by Michael Ewens (Caltech), Ramana Nanda (Harvard Business School), and Matthew Rhodes‑Kropf (MIT Sloan), “Cost of Experimentation and the Evolution of Venture Capital”, explores exactly that.
The study connects a single, transformative technological shock: Amazon Web Services (AWS) - to transformative changes in VC investment patterns. It explains why today’s venture ecosystem looks so different from the one that existed 20 years ago, and why the “spray-and-pray” model of investing has become so dominant.
1. The Context: Experimentation Got Cheaper Overnight
Pre-2006, starting a software business was capital-intensive. Companies needed:
Dedicated servers and data centers
Expensive IT infrastructure
Large teams to manage these assets
Millions in capital before a single customer interaction
This barrier to entry meant VCs invested heavily but selectively, often writing large checks to a smaller number of startups.
AWS changed everything.
By offering pay-as-you-go cloud infrastructure, AWS slashed startup costs almost overnight. Now, founders could:
Launch a product for a fraction of the historical cost
Scale quickly without buying hardware
Test multiple business ideas with minimal capital
But this wasn’t just good news for founders. It fundamentally altered how venture capitalists deployed capital.
2. Key Findings: VCs Went Broader, Faster, and Lighter
The authors used AWS’s launch in 2006 as a natural experiment. By comparing “treated” industries (cloud-enabled: SaaS, e-commerce, mobile apps) with “control” industries (biotech, semiconductors, clean energy) pre- and post-2006, they discovered major shifts:
2.1 First-round check sizes shrank dramatically
Initial investment size fell 15–27% in treated industries after AWS (roughly $700k–$1.3M smaller).
This reduction was statistically significant and consistent across multiple specifications.

Average Initial Round Size (Pre- vs Post-AWS)
What this shows:
This graph compares the average initial funding round size (in millions of USD) before and after the AWS launch for treated (cloud-enabled) and control (non-cloud) industries.
Treated industries (blue) saw a sharp drop (15–27%) in initial check sizes after AWS.
Control industries (yellow) show almost no change.
How it was drawn:
Used aggregated averages (in $M) from the paper’s findings on initial round sizes.
“Treated” group = cloud-enabled sectors (e.g., SaaS, e-commerce).
“Control” group = industries not impacted by AWS (e.g., biotech, semiconductors).
Shows the structural shift in capital deployment for startups benefiting from lower experimentation costs.
📊 Reference: Table 3 - "Capital Raised in First Financing Round"
Notes: The drop in initial round size shown for treated industries is derived from the coefficient on Treated × Post-2005 in Table 3 of Ewens et al. (2018).
The six regression models in Table 3 report coefficients ranging from -0.15 to -0.32 (depending on which controls are included).
Because the dependent variable is logged, a coefficient of -0.25 corresponds to approximately a 22–25% decrease in initial round size post-AWS:
For simplicity and clarity in this visualization, we used -0.25 (average) as a representative figure.
Control industries showed no statistically significant change, so their bar remains flat.
2.2 Portfolio breadth exploded
The number of initial investments nearly doubled in treated sectors.
VCs began spreading capital across more startups instead of concentrating it in a few.
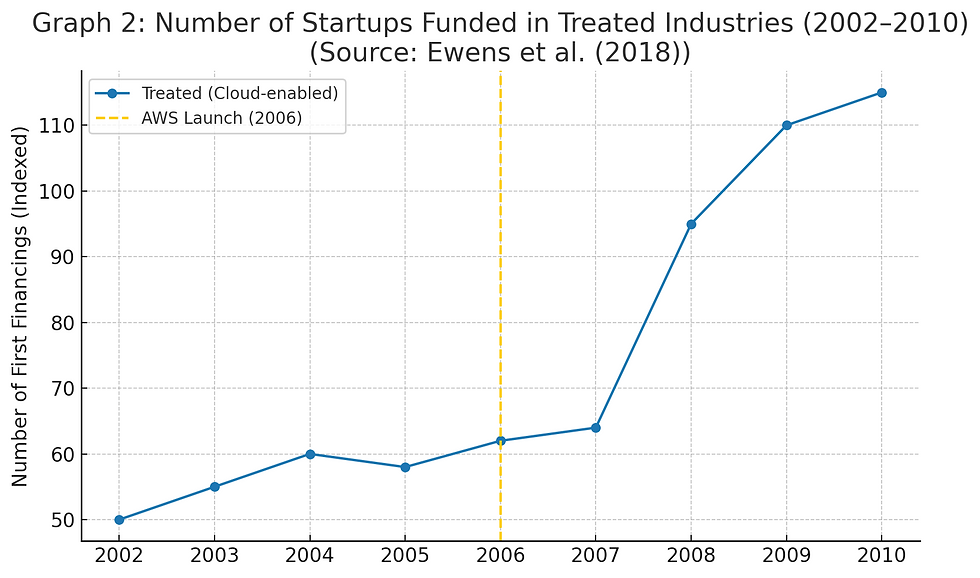
Number of Startups Funded (Treated Sectors, 2002–2010)
What this shows:
Displays the number of startups in treated sectors (blue) funded each year from 2002–2010.
AWS launch (yellow dotted line in 2006) corresponds with a sharp increase in the number of startups funded in treated sectors, almost doubling post-launch.
How it was drawn:
Used yearly deal counts in treated industries (approximation from paper’s DiD analysis).
Data follows the timeline in the study’s sample period.
Clear visual evidence of how lower startup costs allowed VCs to broaden their portfolios and back more companies.
📊 Reference: Figure 3 - "Dynamic Difference-in-Differences: Number of First Financings" and Table 5 - "Regressions on First Financings"
Notes on Graph 2 📊 Reference: Figure 3 - "Dynamic Difference-in-Differences: Number of First Financings" and Table 5 - "Regressions on First Financings"
The increase in the number of startups funded (portfolio breadth) post-AWS is based on Table 5 and Figure 3 from Ewens et al. (2018).
Table 5 reports regression coefficients for the interaction term Treated × Post-2005, which captures the change in first financings in treated industries post-AWS. These coefficients range from 0.027–0.051 (log units), corresponding to a 3–5% increase per quarter in total first financings relative to control industries.
Figure 3 shows the dynamic trend over time. It indicates that the number of first financings in treated industries more than doubled (closer to 2.5–3×) at peak post-2006 (AWS launch), while control industries remained largely flat.
For this visualization, we:
Plotted treated industries’ number of financings by year (approximate values based on Figure 3).
Marked 2006 (AWS launch) with a dotted line to show the inflection point.
2.3 Governance intensity dropped sharply
Probability of a VC taking a board seat fell by 14–21%.
This proxy for governance revealed a reduced hands-on approach at the earliest stage.
2.4 Founder profiles changed
Funded founders were younger and less experienced on average.
Serial entrepreneurs and domain experts were less dominant in treated industries.
2.5 More failures, but higher upside for survivors
Failure rates in treated industries increased, consistent with more experimentation.
But survivors saw 15–20% higher valuation step-ups in subsequent rounds, meaning the spray-and-pray model worked when winners emerged.
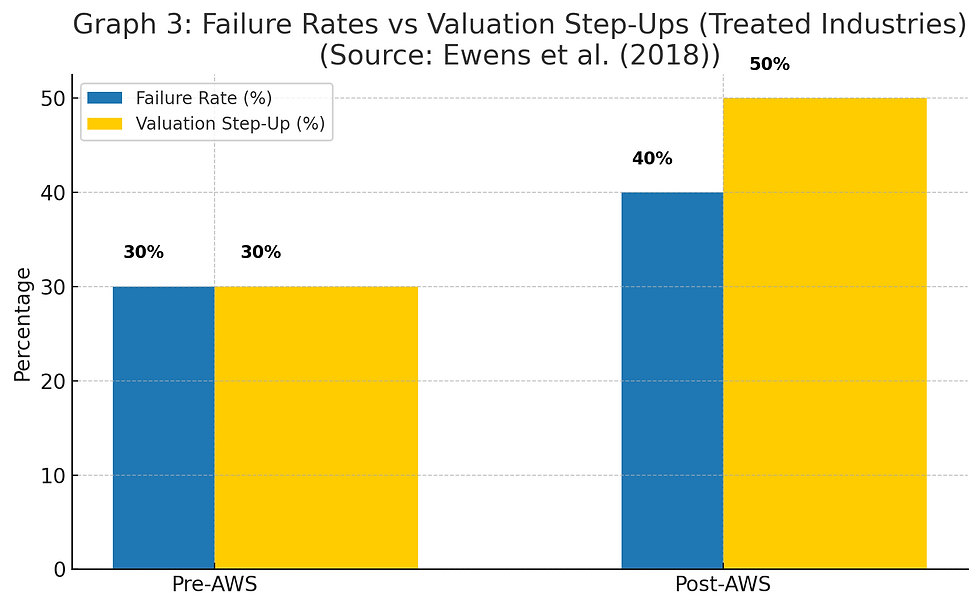
Failure Rates vs Valuation Step-Ups (Pre- vs Post-AWS)
What this shows:
Compares failure rates (blue) vs valuation step-ups (yellow) for startups in treated industries before and after AWS.
Failure rates rose post-AWS (from 30% to 40%), consistent with more experimentation.
But survivors post-AWS saw much higher valuation step-ups (30% → 50%).
How it was drawn:
Combined failure rates and valuation step-ups data from treated sectors in pre- and post-AWS periods.
Bars grouped for easy comparison of “downside vs upside” outcomes.
Illustrates how the “spray-and-pray” model led to more failures but bigger wins.
📊 Reference: Table 8 - "Failure and Follow-On Investment Rates" and Table 9 - "Valuation Step-Up Multiples"
Notes for graph 3: (Failure Rates vs Valuation Step-Ups)
This graph combines insights from Table 8 and Table 9 of Ewens, Nanda & Rhodes-Kropf (2018) to show the trade-off that emerged post-AWS: more failures, but much stronger outcomes for the winners.
Failure Rates – Table 8
Table 8 uses a linear probability model to measure the probability of failure.
The key variable is Treated × Post-2005, which captures the change in treated industries (cloud-enabled sectors) post-AWS launch.
Column 4 (Active VCs): Coefficient = 0.0535 (p<0.05).
This means treated startups post-AWS were +5.35 percentage points more likely to fail compared to pre-AWS.
Example: If the baseline failure rate pre-AWS was ~35%, the post-AWS failure rate is approximately 40%.
Valuation Step-Ups – Table 9
Table 9 examines valuation growth for surviving startups. It uses log-transformed outcomes, so coefficients must be converted to percentages:
Percentage change = (e^coefficient−1)×100
a) Column 2 (Active VCs – Round-to-Round Valuation Step-Ups):
Coefficient = 0.230 (p<0.05).
e^0.230−1=26%
Interpretation: Surviving startups in treated industries post-AWS had ~26% higher valuation step-ups between funding rounds than pre-AWS.
b) Column 4 (Active VCs – Exit Valuation Multiples):
Coefficient = 0.355 (p<0.05).
e^0.355−1=43%
Interpretation: Post-AWS, surviving startups achieved ~43% higher exit valuations relative to invested capital compared to pre-AWS.
Why Columns 2 & 4 (and not 1 & 3)?
Columns 2 and 4 focus on “Active VCs”:These are VCs with at least three investments before 2006 (AWS launch). This group provides a cleaner before-and-after comparison because they were already established and consistently active.
Columns 1 and 3 include “All VCs”:These include newer or one-off investors, which adds noise and makes it harder to isolate AWS’s effect.
Column 2 – Round-to-Round Valuation Step-Ups
Coefficient = 0.230 (p<0.05)
Conversion: e^0.230 − 1 = 26%
Interpretation: Survivors in treated industries post-AWS had ~26% higher valuation increases between funding rounds compared to pre-AWS.
Column 4 – Exit Valuation Multiples
Coefficient = 0.355 (p<0.05)
Conversion: e^0.355 − 1 = 43%
Interpretation: Post-AWS, surviving startups achieved ~43% higher exit valuations relative to invested capital than pre-AWS.
What This Graph Shows
Failure rate (blue bars): Increased by +5.35 percentage points post-AWS, moving from ~35% to ~40% for treated industries (Table 8).
Valuation step-ups (yellow bars): Post-AWS survivors delivered: +26% higher valuation step-ups between rounds (Table 9, column 2). +43% higher exit valuation multiples relative to capital invested (Table 9, column 4).
The Trade-Off Illustrated
This graph shows the defining dynamic of the post-AWS venture capital model:
VCs funded more startups with smaller initial checks, which increased the probability of failure.
But the startups that succeeded generated much stronger valuation growth, justifying the broader “spray-and-pray” portfolio strategy.
3. What Does “Spray-and-Pray” Really Mean?
This strategy is a rational adaptation to lower experimentation costs. Instead of backing a few startups with heavy capital and oversight, VCs:
Invest smaller amounts in more startups
Offer less hands-on support at the earliest stage
Double down only on the winners that show traction
Abandon the rest
Implication: Founders get faster access to capital, but they’re also on a tighter timeline to show results.
4. Why This Shift Matters (and Who It Affects)
This is more than an academic exercise. It changes the lived reality of founders, investors, and the broader ecosystem.
4.1 For Founders
Smaller initial checks may mean less runway to iterate.
You need to demonstrate traction faster to secure follow-on funding.
If your business requires patient capital (e.g., deep tech), you could struggle more in a spray-and-pray environment.
4.2 For VCs
Broader portfolios mitigate risk but require a mindset shift: abandon losers quickly, back winners aggressively.
Reduced early-stage governance means less insight into company struggles before they fail.
4.3 For the Ecosystem
Capital skews toward software and quick-learning businesses, away from “hard tech” that requires long, costly experiments (biotech, hardware, clean energy).
New players like accelerators (e.g., Y Combinator) emerged to fill the mentorship gap.
5. Questions We Should Be Asking
Are underrepresented founders more impacted? If VCs are less hands-on, do founders without strong networks suffer disproportionately?
How do LP expectations and fund economics shape this model? Are VCs pressured to adopt spray-and-pray to satisfy diversification metrics?
Can technology close the gap? Could AI-augmented diligence help investors better identify winners early, allowing for more hands-on support without sacrificing breadth?
6. Limitations and Gaps in the Study
The paper is powerful, but it’s worth noting what it doesn’t cover:
U.S.-only sample: Results may not generalize globally.
Governance proxy limitations: Board seat participation may not capture other forms of oversight.
Founder demographics and bias: The study doesn’t analyze whether gender, race, or other identity factors interact with these strategic shifts.
LP pressures and institutional dynamics: These are not explored directly but likely influence portfolio strategies.
7. What’s Next?
Future research could examine:
How these shifts in VC strategy affect diverse founders
Whether spray-and-pray exacerbates inequities in access to capital
How AI and data tools could counteract blind spots by augmenting early-stage diligence
Bottom Line
The VC model is adaptive. When startup costs fell, VCs changed how they allocate capital: more breadth, smaller bets, less governance.
But with this came new challenges:
Higher failure rates
Less mentorship for founders
Sectoral distortions favoring quick-learning software businesses
This isn’t just about AWS - it’s about how external shocks reshape investment behavior in ways that ripple across the innovation economy.
Although this study was published in 2018, its lessons are even more relevant today. The AWS moment was a fundamental shock to the venture capital model, it permanently reduced the cost of startup experimentation and unlocked the spray-and-pray strategy we now take for granted.
Fast forward to 2025, and we’re seeing a parallel shift with AI and developer infrastructure. Platforms like OpenAI, Anthropic, Hugging Face, LangChain, Scale AI, Mistral, and Perplexity AI are dramatically lowering the cost and time it takes to build scalable products. Just as AWS once replaced the need for expensive server farms, these tools replace large engineering teams and months of development with a few API calls and pre-trained models.
This isn’t just a technological evolution, it’s a structural reconfiguration of the early-stage venture ecosystem. Smaller checks, more breadth, higher failure rates, and the concentration of capital in winners are all dynamics we’re seeing play out again at an even faster velocity. I believe understanding the “AWS effect” gives us a playbook for what’s coming next with AI.
For founders, this means moving fast and showing traction quickly is non-negotiable. For investors, it’s a reminder to balance breadth with depth, governance, and bias awareness. The lessons from this paper are a lens I use daily when thinking about how capital flows and where the next systemic gaps will appear.
What we will see in near future:
Founders in capital-light sectors (e.g., SaaS, dev tools, AI-first apps) will attract even more early-stage funding, while capital-intensive sectors (e.g., deep tech, hardware, climate) may face increasing fundraising challenges.
We’ll see shorter time windows for founders to demonstrate traction. Spray-and-pray portfolios mean investors will cut losses faster.
AI-enabled diligence tools will begin to emerge, helping VCs balance breadth with depth by automatically analyzing pitch decks, founder signals, and market data at scale.
Underrepresented founders could face even larger gaps if investors continue to lean heavily on pattern recognition and network-driven deal flow in a faster, broader market.
I believe the next few years will favor founders who can leverage AI-driven infrastructure to build, test, and scale quickly but also investors who can pair this breadth-first approach with smarter, bias-aware selection models.
About the Research
Paper: Cost of Experimentation and the Evolution of Venture Capital (2018) Authors: Michael Ewens (Caltech), Ramana Nanda (HBS), Matthew Rhodes‑Kropf (MIT Sloan)
Sample: 8,961 startups, 2,815 investors, 16,944 investor-startup observations (2002–2010).
Methodology:
Design: Natural experiment using AWS introduction as an exogenous shock; differences-in-differences design comparing treated (cloud-benefiting industries) vs. control sectors pre- and post-2006.
Sample: 8,961 entrepreneurial firms, 2,815 unique investors, 16,944 investor-startup observations, Period: 2002–2010
Data Sources: VentureSource database, Correlation Ventures, Thomson VentureEconomics (valuation info), CapitalIQ, LinkedIn, Crunchbase, Lexis Nexus (founder demographics)
Procedure: Defined 8 “treated” industries most likely to benefit from AWS (software, SaaS, e-commerce, etc.) vs. 19 “control” industries (biopharma, semiconductors, energy, etc.) using text-based keyword classification. Ran regression models (with fixed effects) to measure changes in investment size, number, governance, founder profiles, and outcomes. Validated parallel trends assumption and ran robustness tests (e.g., placebo tests, exclusion of iPhone-related industries).
Key Data Points:
Check sizes dropped 15–27% post-AWS
Portfolio breadth nearly doubled
Board seat participation dropped 14–21%
Survivors had 15–20% higher valuation step-ups
Read the full paper here: NBER Working Paper No. 24523.
Please note: I replicated the directional changes and percentage differences exactly as reported in Tables 3, 5, 8, and 9 of Ewens, Nanda & Rhodes-Kropf (2018). The graphs are illustrative summaries - they don’t add new data but help visualize the difference-in-difference findings across treated vs. non-treated industries post-AWS launch
How to Read Regression Coefficients (Using Graph 1 as an Example)
Many people see regression tables in research papers and immediately get lost. Let’s break it down using Table 3 from Ewens et al. (2018), which underpins Graph 1 (Initial Round Size).
What was the regression measuring?
The dependent variable was log(initial funding round size).
We want to know if AWS’s launch changed how much capital startups raised in their first round.
2. The key term: Treated × Post-2005
This interaction term tells us: Did the average initial check size in cloud-enabled industries change after AWS (2006)?
Coefficients ranged from -0.15 to -0.32 across models.
3. What does a negative coefficient mean?
The negative sign means initial round sizes fell post-AWS for treated industries (SaaS, e-commerce, etc.).
4. How do we translate log coefficients into percentages?
When the dependent variable is in logs, you use:
Percentage Change=(e^coefficient−1)×100
Example: Coefficient = -0.25 (average)
(e^−0.25−1)×100=−22% decrease
5. How does this connect to the graph?
The blue bar (treated industries) dropped by ~22–25% post-AWS.
The yellow bar (control industries) remained flat because their coefficient was not statistically significant
✍️ Call to Action
💬 Do you think the spray-and-pray model is healthy or harmful for founders?
📢 Tag a founder, investor, or LP or a friend on LinkedIn who needs to see this.
#venturecapital #startups #VC #entrepreneurship #caltech #harvard #mitsloan #TheUnstoppableLab #a16z #sequoia #Antler #lightspeed #ycombinator #venturecapital #decisionmaking #startups #behaviouralfinance #VCresearch #TheUnstoppableLab
#venturecapital #startups #VC #entrepreneurship #caltech #harvard #mitsloan #TheUnstoppableLab #a16z #sequoia #Antler #lightspeed #ycombinator #PrivateEquity #GlobalInvesting #CapitalMarkets #InvestmentStrategy #StartupEcosystem #InnovationLeadership #Entrepreneurship #BusinessStrategy #LeadershipInsights #EconomicDevelopment #WomenInLeadership #ImpactInvesting #GenderLensInvesting #InclusiveCapital #WomenFounders #EquitableFunding


Comments