Global Capital Allocation (Florez-Orrego, Maggiori, Schreger, Sun, Tinda, 2024)
- Hurratul Maleka Taj
- Aug 25, 2025
- 6 min read
Florez-Orrego, Sergio, Matteo Maggiori, Jesse Schreger, Ziwen Sun, and Serdil Tinda. Global Capital Allocation. Annual Review of Economics 16: 623–653, 2024. https://doi.org/10.1146/annurev-economics-081623-020427.
(Cluster B — Global Capital Allocation Networks)
1. Research Question: The paper investigates who owns what globally, documenting how international portfolios are measured, intermediated, and distributed across countries, currencies, and institutional structures. It asks how cross-border investment patterns evolve and what drives the composition of global financial positions when measured through residency, nationality, and currency denomination lenses.
2. Literature Gap: Existing global datasets rely heavily on residency-based multilateral statistics (BoP, IIP) that obscure actual exposures, misclassify tax-haven pass-throughs, hide nationality distortions, and fail to capture micro-level ownership, currency denomination, and hidden wealth embedded in off-shore structures. These gaps limit the ability to address fundamental questions in international macro-finance.
3. Central Contribution: The paper provides a comprehensive empirical architecture of global capital allocation - combining aggregate IIP/BoP data, bilateral surveys, and micro-level securities to restate global positions on a nationality basis. It documents the dominance of portfolio investment, the centrality of currency denomination, persistent home-currency bias, the sovereign–corporate divergence in currency choice, and the distortions created by tax-haven routing and VIE structures.
4. Analytical Framework:
The paper structures global positions using the Net Foreign Asset identity:

The dynamics of a country’s net foreign asset position can be accounted for as:

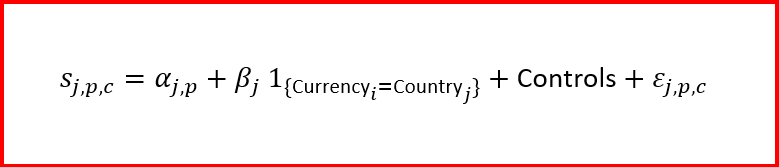
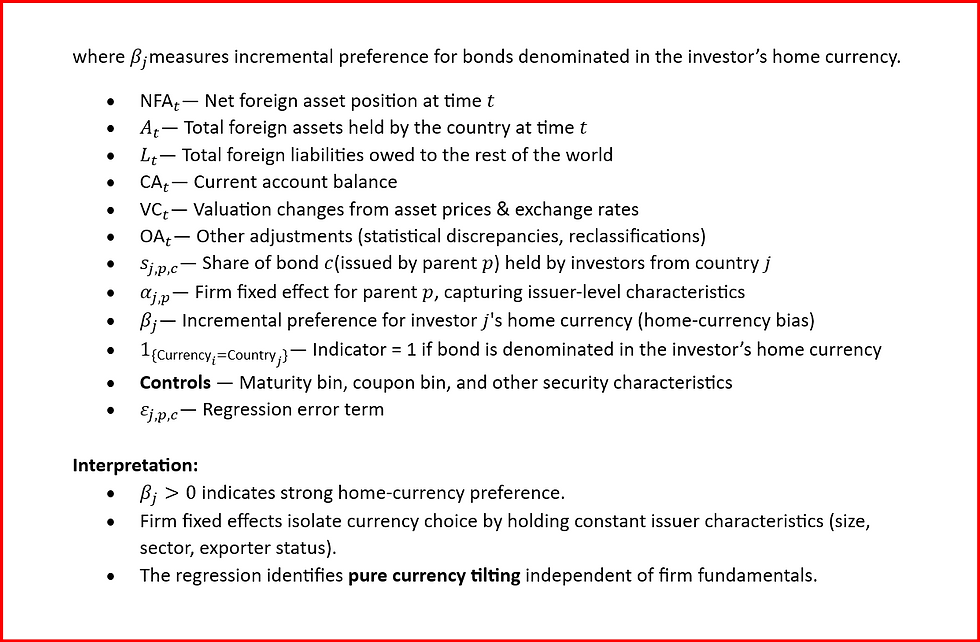
It quantifies home-currency bias using:
5. Methodology: The authors integrate multilateral (BoP, IIP), bilateral (CPIS, CDIS, BIS-LBS), and security-level micro-data from mutual funds, ETFs, insurers, sovereign wealth funds, ECB SHS, Morningstar, and NAIC. They map bonds from immediate issuer to ultimate parent, and create a nationality-based restatement of global portfolios. Cross-country evidence compares sovereign vs. corporate currency denomination, VIE structures, and tax-haven pass-throughs.
6. Key Findings
Global Patterns
Gross cross-border assets and liabilities have expanded sharply since 1980, approaching USD 200 trillion in total value by 2020.
Portfolio investment dominates; “Other Investment” declined.
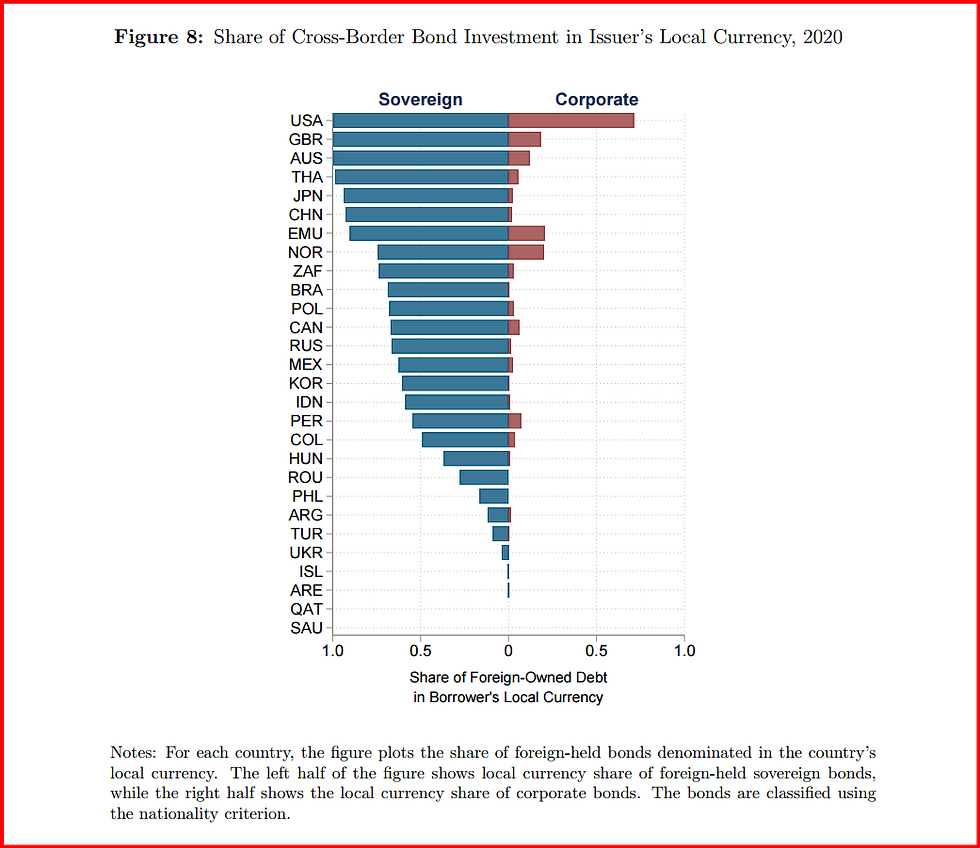
EM sovereigns increasingly borrow in local currency.
Currency Denomination & Firm Behavior
Domestic investors overwhelmingly hold corporate bonds in local currency.
Foreign investors rarely do—except in USD, whose global share increased sharply after the GFC.
EM sovereigns issue in local currency, corporates do not (even within the same firm).
Home Currency Bias
Very high β estimates: CAN 0.849, EMU 0.622, USA 0.690.
Currency explains more variation than issuer nationality.
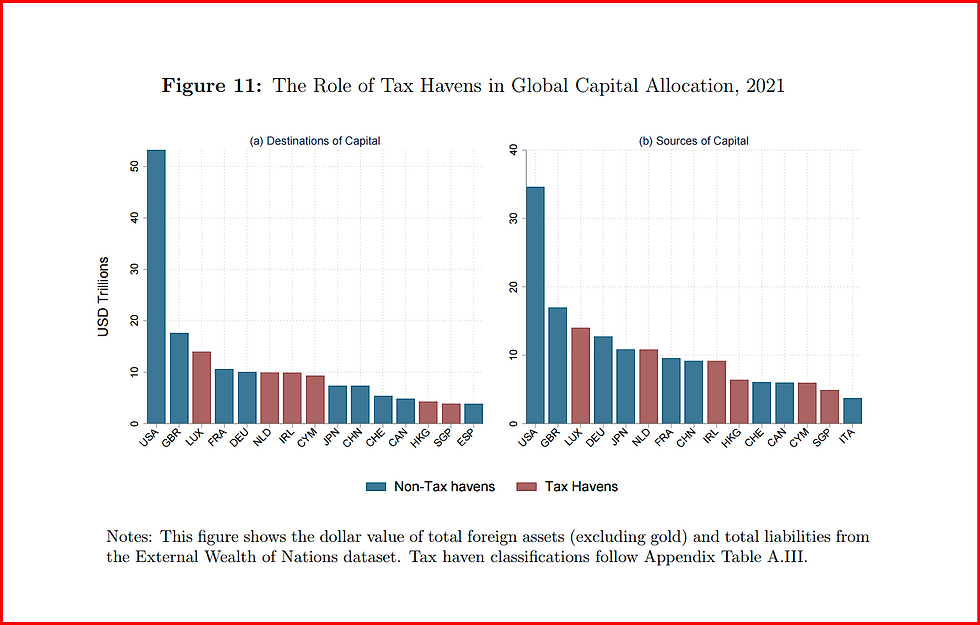
Tax Havens & Nationality Restatements
Cayman, Luxembourg, Ireland dominate reported flows.
Nationality restatement dramatically increases measured exposure to China due to VIEs.
Missing Wealth & Investor Heterogeneity
World appears as net debtor by ~$8T due to hidden wealth.
Insurers are “safe hands”; mutual funds exhibit fire-sales.
7. Placement Within Cluster B: This paper is foundational to Global Capital Allocation Networks, offering the empirical map of global positions, currency segmentation, intermediary structures, tax-haven routing, and nationality corrections. It defines the data architecture required for modeling global financial linkages and cross-border balance-sheet exposures.
Note:
This summary is part of my ongoing research project exploring the global architecture of international finance. The project is structured around three conceptual clusters:
Cluster A — Geoeconomic Power & Coercion
Cluster B — Global Capital Allocation Networks
Cluster C — Currency Competition & Safe-Asset Dominance
8. Implications: The findings imply that international macro-finance models must integrate currency segmentation, home-currency bias, and limited intermediary capacity. Policymakers must move beyond residency-based statistics and adopt nationality restatements. Exchange-rate dynamics are heavily influenced by foreign demand for USD-denominated assets, while tax havens distort risk assessments and geopolitical interpretation.
9. Concepts in the Paper: Net foreign assets; valuation effects; BoP/IIP frameworks; gross vs. net positions; portfolio dominance; residency vs. nationality; currency denomination; home-currency bias; sovereign–corporate currency divergence; tax-haven pass-through; VIE structures; missing wealth; micro-investor heterogeneity; FX hedging; CIP deviations; segmented markets; USD dominance; fire-sale vs. safe-hand investors.
Figures from the paper:


Simple Explanation | Non-Technical Summary
Imagine the whole world’s money as a giant map of who owns what in other countries.
This paper asks:
How does money travel across countries, who is holding which financial assets, in which currency, and what mistakes happen when we measure it?
The world is incredibly interconnected, and the authors want to show: what this map actually looks like,why we’ve misunderstood parts of it, and how to correct it.
PART 1 — What is the World’s “Money Map”?
Every country owns assets in other countries:
bonds,
stocks,
loans,
foreign reserves,
and companies operating abroad.
Countries also owe money to foreigners.
To track this, economists use something called:
Net Foreign Assets (NFA)
It’s simply:
All the foreign stuff we own – all the foreign stuff we owe.
That’s the equation you saw:
NFA = A – L (Assets minus Liabilities.)
If A > L → country is a net creditor. If L > A → country is a net debtor.
This is the first major building block.
PART 2 — But There’s a Problem… We’ve Been Measuring It Wrong
Traditional global databases count things based on where companies’ legal addresses are, not where the real companies actually live.
Example:
Petrobras (Brazil) actually borrows through Cayman Islands shells.
So if an American buys its bond, statistics say:
USA → Cayman Islands
But economically, it’s actually:
USA → Brazil (Petrobras)
This means:
A huge amount of money is misclassified.
Tax havens distort the global map.
We underestimate exposures to places like China and Brazil.
We misinterpret global risk.
The paper fixes this using a method called:
Nationality-based restatement
→ Look through the shell company to the ultimate parent.
This is a central contribution.
PART 3 — Currencies Matter More Than Countries
Now imagine you’re choosing a chocolate bar. You only like chocolate wrapped in blue wrappers, not red ones.
Similarly:
Investors strongly prefer buying bonds in THEIR OWN currency.
This is called home-currency bias.
For example:
Canadian investors prefer Canadian-dollar bonds.
Europeans prefer euro bonds.
Americans prefer dollar bonds.
And how do we know this? They run a regression:
Do investors buy more of a bond when it is in their own currency?
This is the equation:s = α + β × Home Currency + controls
If β is big, it means:
Investors strongly tilt toward their home currency.
And the results?
β is HUGE everywhere.
CAN = 0.849 USA = 0.690 EMU = 0.622
So the paper proves:
Currency is more important than nationality in explaining who buys what.
This is why the USD dominates.
PART 4 — Corporates and Governments Behave Differently
Something surprising:
Emerging-market governments issue bonds in local currency.
But their own corporations do not. Even inside the same country.
Why?
Because:
Foreign investors do not want local currencies.
So corporates must issue in dollars to attract investors.
This split drives huge global imbalance patterns.
PART 5 — The USD is Becoming Even More Dominant
After the financial crisis, the dollar became the world’s “safe asset.”The paper shows:
Cross-border use of USD increased sharply.
Euro shrank in importance.
Many models of exchange-rate movements depend on foreign demand for USD assets.
This ties into modern macro-finance work (Jiang, Kekre-Lenel, Devereux, etc.)
PART 6 — Tax Havens Change Everything
This paper shows visually:
A shocking amount of world finance passes through:
Cayman Islands
Luxembourg
Ireland
When the authors look through these tax havens, they find:
The U.S. invests far more in China than official data shows.
Official “residency-based” numbers say:→ ~3% of U.S. equity flows go to China.
Nationality-based correction shows:→ ~13% (an additional $850 billion).
This is because:
Chinese tech giants (Alibaba, Tencent) use VIE structures to raise money via Cayman entities.
So again:
We are measuring the world wrong — and badly underestimating China exposure.
PART 7 — Missing Wealth
There are ~$8 trillion in unrecorded assets globally.
Meaning:
The world appears like a big net debtor,
But a lot of household wealth is hidden in unreported foreign accounts.
This makes global imbalances look worse than they are.
PART 8 — Not All Investors Behave the Same
Using micro-data from mutual funds, insurance companies, sovereign wealth funds:
Mutual funds
Trade frequently
Fire-sell in crises
Insurers
Slow, stable, "safe hands"
This matters for:
capital flows,
exchange rates,
risk transmission,
and modeling crisis dynamics.
SO WHAT IS THE PAPER REALLY SAYING?
Countries own lots of financial assets abroad.
The way we count who owns what is broken.
A lot of money passes through tiny islands (tax havens), not the real countries.
If you fix the measurements, the world looks totally different.
Investors buy things mainly in their own currency — not from their own country.
This makes the U.S. dollar incredibly powerful.
Sovereigns and corporates behave differently when borrowing.
Different investor types affect exchange rates and global risk.
That’s the whole story.


Comments